What is NDVI? NDVI Equation, MODIS, Landsat, Sentinel 2: Powering Precision Agriculture & Vegetation Monitoring in 2026
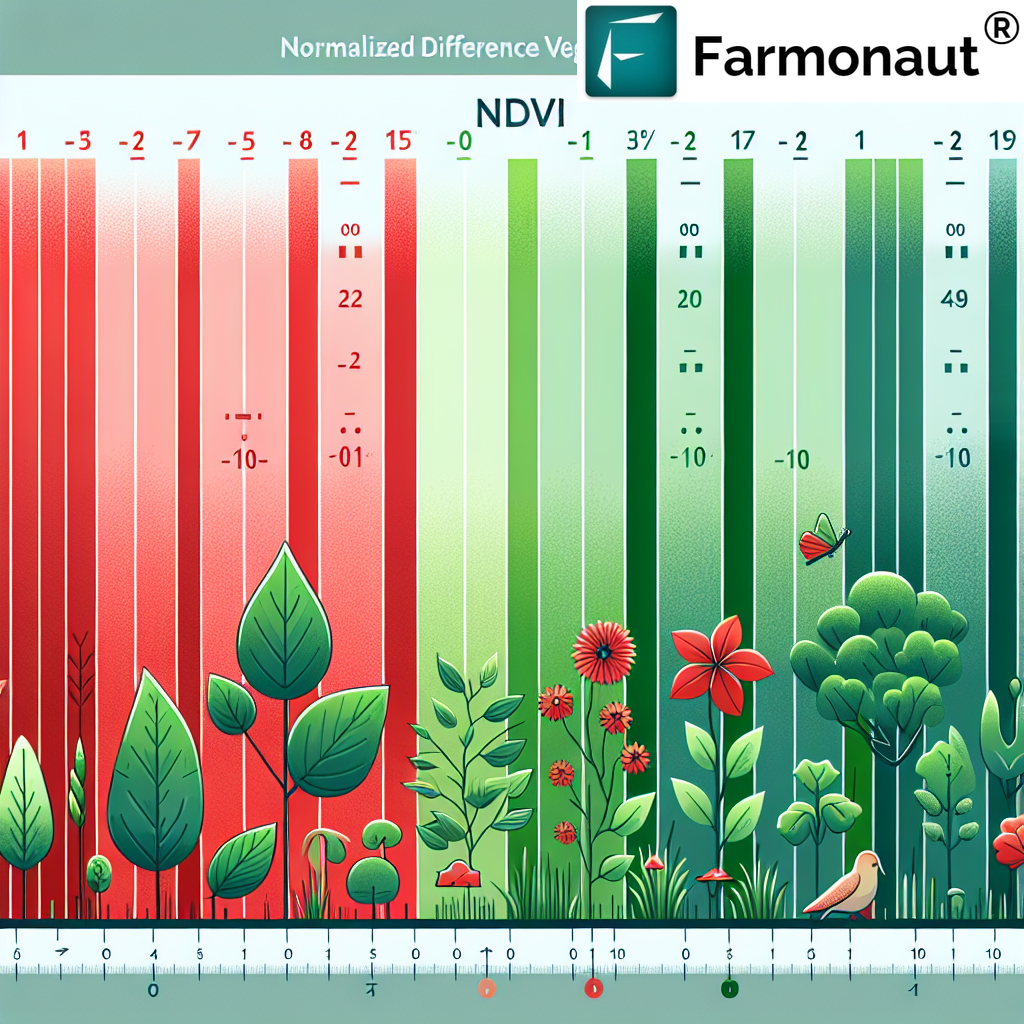
“NDVI values range from -1 to 1, with healthy vegetation typically showing between 0.3 and 0.8 in satellite data.”
🌍 Introduction
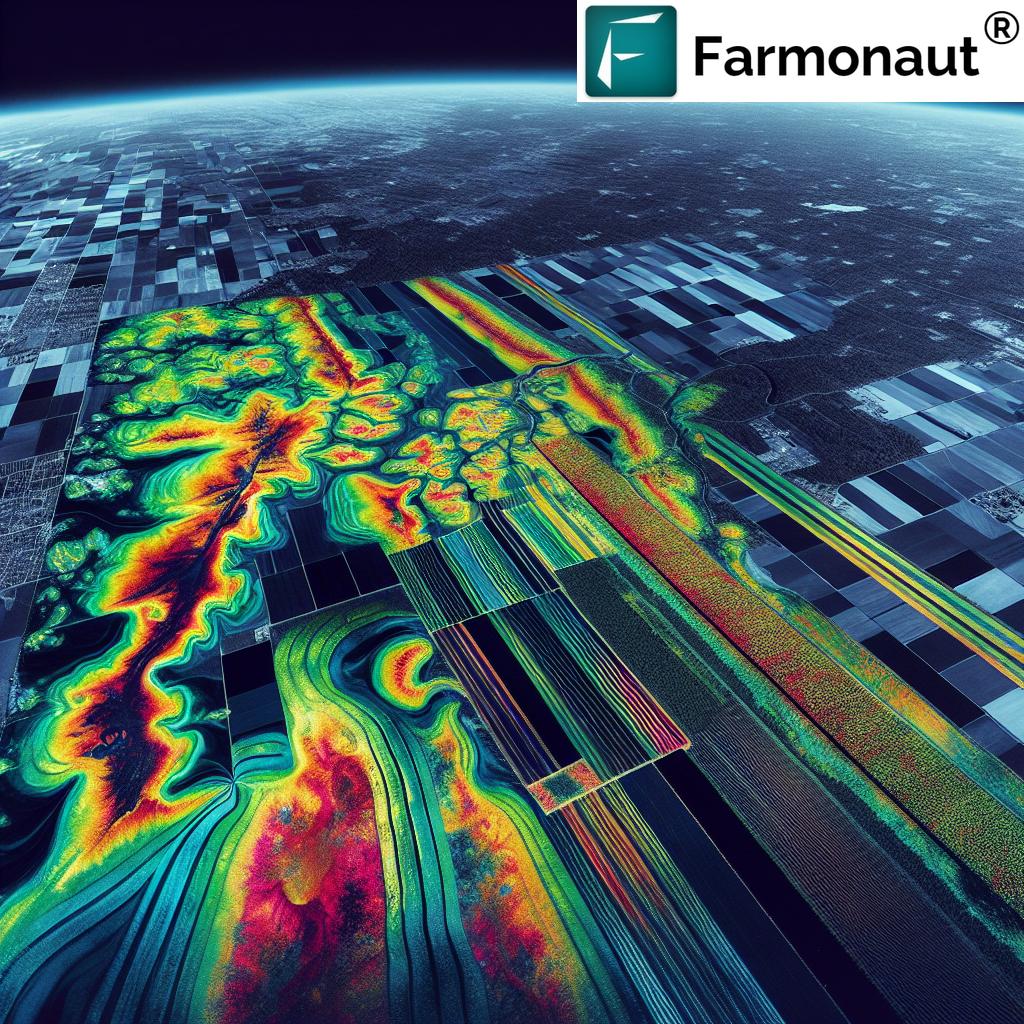
In our rapidly changing world, remote sensing technologies have become indispensable for agriculture, forestry, and environmental monitoring. Leading this revolution is the Normalized Difference Vegetation Index (NDVI), a numerical indicator widely used to accurately assess vegetation health, crop vigor, forest productivity, and land degradation. NDVI leverages satellite imaging and advanced analytics to deliver actionable insights for sustainable land management, precision farming, and effective decision-making.
This comprehensive guide explores “what is NDVI”, the NDVI equation, and how major satellite platforms like MODIS, Landsat, and Sentinel-2 enable precision agriculture, innovation, and ecological research now and into 2026 and beyond.

🔑 Key Insight
NDVI stands as a critical remote sensing metric for agriculture and forestry. Its simplicity, accuracy, and accessibility make it the backbone of modern land and biomass monitoring.
What is NDVI? Key Concepts and Principle
What Does NDVI Stand For?
NDVI stands for Normalized Difference Vegetation Index. It is a widely used numerical indicator in the field of remote sensing—an essential tool to assess, monitor, and track the health and biomass of vegetation using information from the visible (especially the red) and near-infrared (NIR) bands of the electromagnetic spectrum.
NDVI: Principle and How It Works
The principle behind NDVI is elegantly simple yet scientifically sound. Chlorophyll, the main pigment in green, healthy vegetation, absorbs most of the incoming solar visible light (particularly the red wavelengths) for photosynthesis. Simultaneously, healthy plant leaves reflect a significant portion of the near-infrared (NIR) radiation. In contrast, barren land, water, snow, and clouds have different patterns of absorption and reflectance.
By measuring this difference between absorbed red and reflected NIR light, NDVI quantifies vegetation density, greenness, and vitality in a given area.
- ✔ Red Light Absorption: Chlorophyll in vegetation absorbs red wavelengths for photosynthesis.
- ✔ NIR Reflectance: Healthy plant leaves reflect near-infrared light strongly.
- ✔ Spectral Contrast: The greater the difference, the healthier and denser the vegetation cover.
- ✔ Index Calculation: NDVI uses the contrast to generate a value (-1 to +1) representing vegetation condition.
💡 Pro Tip
For the most accurate crop and land management, use NDVI in combination with other indices (EVI, SAVI) and field observations.
NDVI in the Electromagnetic Spectrum
The electromagnetic spectrum includes all wavelengths of light, but NDVI focuses on two highly informative bands:
- Red Band (Visible Red): **Strongly absorbed** by healthy leaves—photosynthesis at work.
- NIR Band (Near-Infrared): **Strongly reflected** by internal structure of green leaves; the more NIR reflected, the healthier/denser the vegetation.
By analyzing remote sensing measurements from satellites, we assess whether the target area contains live, green vegetation—a critical metric in agriculture, forestry, and environmental monitoring.
NDVI Equation: Formula, Bands, and Value Ranges
The NDVI Equation Explained
NDVI is calculated using the following formula:
- NIR: Reflectance value in the Near-Infrared band (typically 0.7–1.1 μm)
- RED: Reflectance value in the Red band (typically 0.6–0.7 μm)
Interpreting NDVI Values
- • +0.8 to +1 — Dense, healthy vegetation (lush crops, forests)
- • +0.3 to +0.7 — Moderate to high vegetation (grasslands, crops)
- • 0 to +0.3 — Sparse vegetation or bare soil
- • 0 to -1 — Water bodies, snow, clouds, non-vegetated surfaces
NDVI values close to +1 generally indicate live, dense vegetation, while values near zero or negative signal sparse cover, barren land, or presence of water, snow, or clouds.
⚠ Common Mistake
Interpreting NDVI without accounting for seasonal, regional, or crop-stage differences can lead to erroneous conclusions. Always relate NDVI readings to reference data, ground truth, and historic trends.
MODIS NDVI: Global Moderate-Resolution Vegetation Tracking
Overview of MODIS and Its Role
The Moderate Resolution Imaging Spectroradiometer (MODIS), launched aboard NASA’s Terra (1999) and Aqua (2002) satellites, provides one of the most widely used global NDVI datasets. MODIS imaging collects near-daily observations at moderate spatial resolutions (typically 250m–1km), covering the Earth’s land and water surfaces.
Key Features of MODIS NDVI:
- 🌍 Global coverage — ideal for regional to international vegetation monitoring
- 📊 Moderate spatial resolution (250m–1km)
- 🗓 High revisit frequency (1–2 days)—near-real-time vegetative change tracking
- 🔍 Standardized NDVI products (e.g., MOD13, MYD13 series)

MODIS NDVI: Applications
- 🌱 Crop Monitoring: Identify crop stress, track agricultural productivity and phenology (growth stages) over large areas.
- 🌳 Forest Health: Detect forest cover loss, fires, or outbreaks.
- 🌍 Drought Detection: NDVI anomalies highlight low biomass or water stress regions globally.
- 🏞 Environmental Studies: Assess ecological changes, land degradation, and natural disaster impacts.
📊 Data Insight
MODIS NDVI datasets are invaluable for regional-scale analysis, providing timely snapshots that support water use efficiency, drought detection, and agricultural policy making— essential for food security in the digital era.
Landsat NDVI: Field-Scale Precision Monitoring
Overview of Landsat Missions
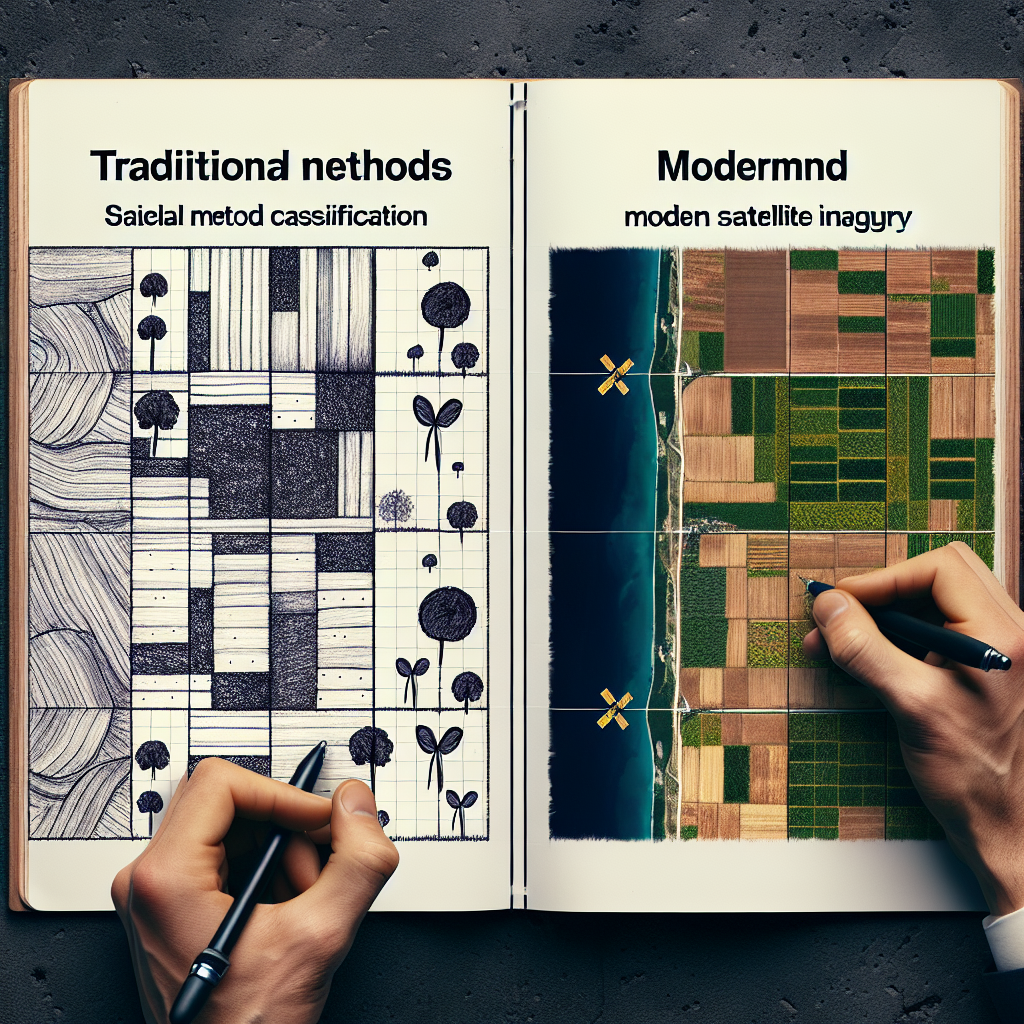
The Landsat program, a flagship NASA & USGS initiative, has been capturing the Earth’s changing land surface since the 1970s. Landsat satellites such as Landsat 8 and Landsat 9 deliver high-spatial-resolution imagery (30m), ideal for field-level agricultural management, urban mapping, and forest monitoring.
Key Features of Landsat NDVI:
- 🚜 High spatial detail (30m)—perfect for individual farms and field parcels
- 📅 Semi-monthly revisit (~16 days)—enables seasonal trend analysis
- 🔬 Proven, stable data—over 50 years of Earth surface monitoring
- 📈 Historical archive—track land use, agricultural shifts, and deforestation
Landsat NDVI Applications
- 📋 Precision Farming: Monitor intra-field crop variability, detect nutrient or water stress for targeted interventions
- 🌲 Forest Management: Map tree cover, monitor biomass changes, detect illegal logging or disease outbreaks
- 🛣 Land Degradation Monitoring: Identify soil erosion, urbanization, and reclamation opportunities
- 📆 Phenology Tracking: Compare seasonal crop growth, predict harvest dates, and estimate yield
Landsat NDVI data continues to stand out in precision agriculture—enabling fine-scale management decisions and sustainability assessments.
💼 Investor Note
With land intelligence and satellite NDVI analytics, investors and agribusinesses can better assess field performance, risk, and future yields—making data-driven decisions in agriculture or mining.
Sentinel-2 NDVI: High-Resolution, Near-Real-Time Data
Sentinel-2: A Game-Changer in Vegetation Monitoring (2025-2026)
The European Space Agency’s Sentinel-2 mission, launched in 2015, delivers multispectral NDVI imagery at an unrivaled 10–20m spatial resolution and a rapid 5-day revisit cycle. This frequency, combined with tailored Red and NIR spectral bands, makes Sentinel-2 NDVI a gold standard for precision agriculture in 2025 and beyond.
Highlight: “Sentinel-2 captures multispectral NDVI imagery at a spatial resolution as fine as 10 meters every 5 days.”
Key Features of Sentinel-2 NDVI
- 🛰 Very high spatial resolution (up to 10m)
- ⏱ Frequent revisit rate (every 5 days)—ideal for real-time decision making
- 🌾 Optimized bands for vegetation indices (including NDVI, EVI, RECI, etc.)
- 🌍 Global and regional cover—free and open datasets
Sentinel-2 NDVI: Use Cases
- 🌾 Variable Rate Application: Guide site-specific fertilization or irrigation in precision farming
- 🔬 Crop Stress Detection: Identify early-stage pest outbreaks, disease, or drought impacts
- 🌲 Forest Biodiversity: Monitor tree species, density, and post-disturbance regrowth
- ⏳ Natural Resource Management: Track wetlands, flood impacts, and land recovery efforts
🌱 Sustainability Focus
Sentinel-2 NDVI enables sustainable agriculture by empowering farmers to optimize resource usage, reduce input costs, and enhance crop yield while protecting natural ecosystems.

NDVI from MODIS, Landsat, and Sentinel-2: Key Specifications
| Satellite / Instrument | Spatial Resolution | Revisit Frequency | NDVI Bands Used | Data Availability | Key Agricultural Applications |
|---|---|---|---|---|---|
| MODIS (Terra, Aqua) |
250m (best) | 1–2 days | NIR (841-876nm) / Red (620-670nm) | Global | Regional crop and forest monitoring, drought detection, large-scale phenology |
| Landsat 8/9 | 30m | 16 days | NIR (851-879nm) / Red (636-673nm) | Global | Field-level precision agriculture, crop health, forest management, yield estimation |
| Sentinel-2A/B | 10m | 5 days | NIR (842nm) / Red (665nm) | Global / Regional | Real-time crop monitoring, intra-field variability, stress detection, precision management |
“Sentinel-2 captures multispectral NDVI imagery at a spatial resolution as fine as 10 meters every 5 days.”
Importance of NDVI in 2025+ Agriculture & Forestry
As of 2026, NDVI continues to be a critical tool for sustainable land management, precision farming, and ecological research. Its ability to provide timely, accurate, and scalable insights fuels innovation and efficiency across global agriculture and forestry sectors.
Why is NDVI Essential for Modern Agriculture and Forestry?
- 🌟 Precision Farming: Targeted input application for fertilizers, irrigation, and pesticides for optimized yield.
- 📉 Early Stress Detection: Identify water scarcity, pest, or disease stress to act before yield loss.
- 🌍 Food Security Monitoring: Governments and agencies track crop health on a regional and global scale.
- 🌳 Forest Change Detection: Monitor deforestation, forest fires, and restoration projects for sustainability.
- 📅 Climate Adaptation: Assess ecosystem responses to climate change and guide policy.
Environmental and Economic Benefits
- Improved resource management (water, nutrients, land use)
- Reduced environmental impact via timely interventions
- Boosted crop productivity and profitability
- Data-driven sustainability planning for carbon, biodiversity, and restoration initiatives
- Continuous, independent land monitoring
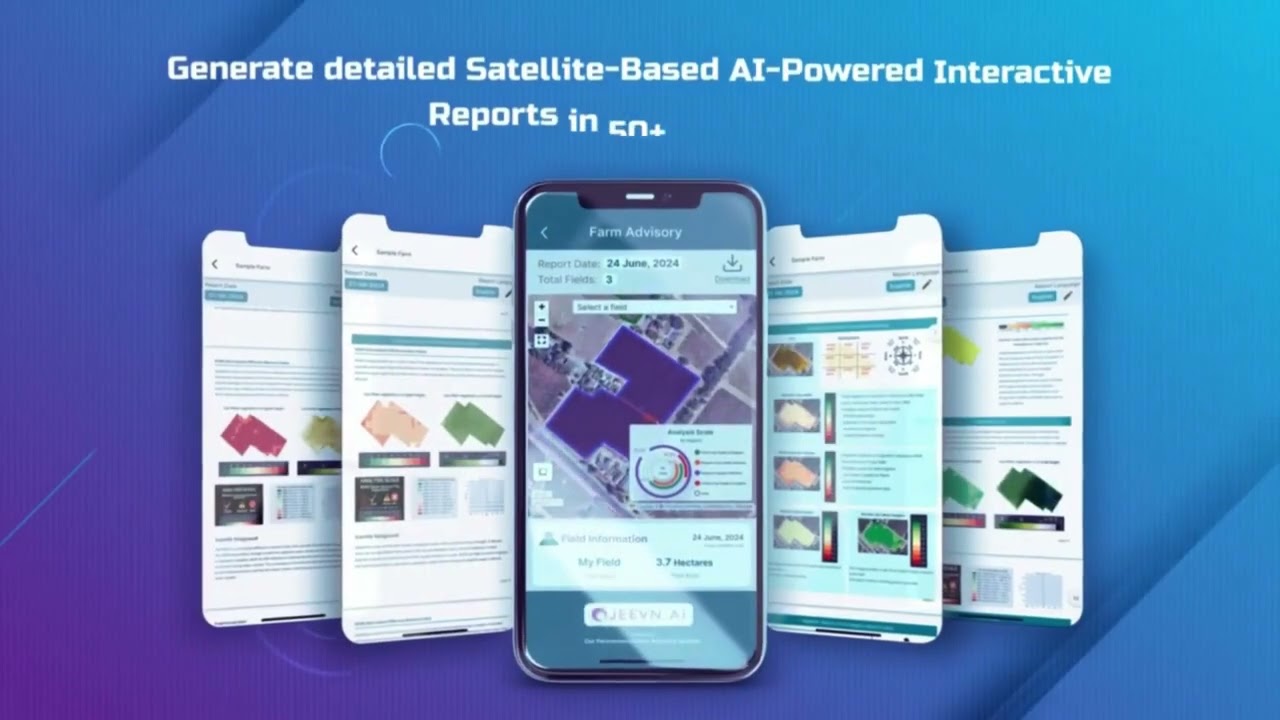
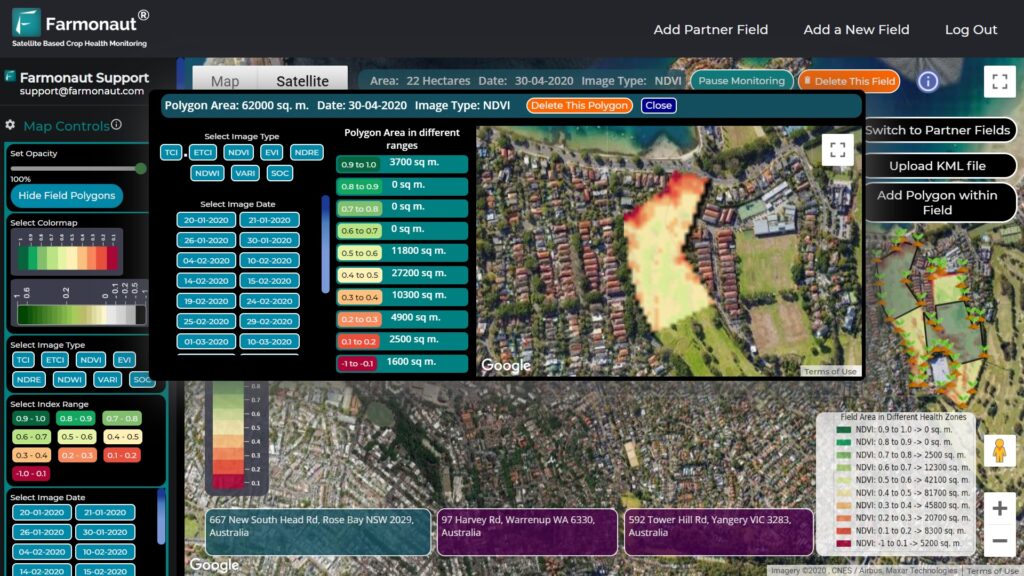
Farmonaut & NDVI: Satellite-Powered Solutions for 2026+
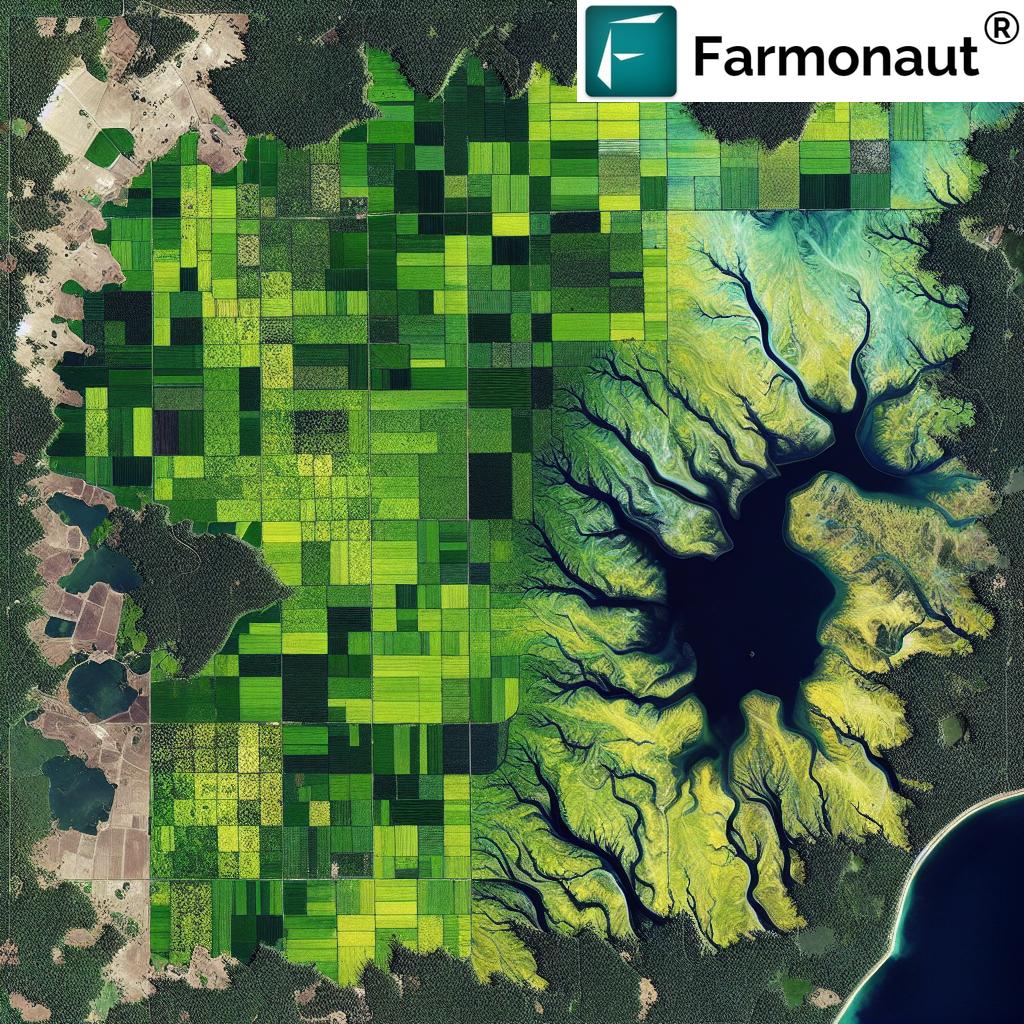
At Farmonaut, we are dedicated to making satellite-driven NDVI insights affordable, actionable, and accessible for everyone involved in agriculture, mining, infrastructure, and environmental management. Our platform leverages the full power of remote sensing, artificial intelligence (AI), blockchain, and real-time advisory systems to equip farms and businesses for the future.
-
🛰️
Satellite-Based Monitoring: Multispectral imagery and NDVI for crop health, forest cover, soil conditions, and more. -
🤖
AI-Powered Advisories: Advanced insights, alerts, and tailored recommendations for optimal input usage. -
📝
Blockchain Traceability: Transparent provenance tracking of crops and resources. Read more. -
🌍
Environment Impact Tracking: Real-time carbon footprint and ecosystem health metrics. View our solutions. -
🚜
Fleet & Resource Tools: Optimize logistics, safety, and management in agricultural and mining operations. Learn about our Fleet Management.
We also champion API accessibility—integrating NDVI and other index data feeds directly into third-party platforms for custom applications. Read the API developer documentation.
For agro-administrators and large-scale producers, try our advanced Large Scale Farm Management platform—manage monitoring, advisories, and insights at scale.


Start monitoring your crops, forests, or projects with advanced NDVI and AI tools today.
Common NDVI Applications & Pro Tips
- ☑ Crop Growth Monitoring: Track and forecast growth stages, stress, and yield using satellite NDVI time-series.
- 👍 Variable-Rate Management: Apply fertilizers, pesticides, and water variably across fields—improving efficiency and reducing costs.
- ♻ Land Degradation & Recovery: Map erosion, urban expansion, and monitor natural restoration efforts.
- 🌳 Ecological Research: Assess biodiversity, carbon sequestration, and impacts of conservation policies.
- 💡 Insurance & Loan Verification: Use NDVI evidence for claim validation and risk assessment. Check out our Crop Loan & Insurance product.
- 📈 Yield Forecasting: Leverage historical NDVI patterns to estimate upcoming harvest outcomes.
- ❗ Early Issue Detection: Spot asymmetric field growth or pest zones before losses occur.
- ⚡ Rapid Disaster Assessment: Characterize flood, drought, wildfire, or hail damage for fast response.
- 🛡️ Infrastructure Planning: Integrate NDVI data for site selection, project safety, and minimizing ecosystem impact.
- 📊 Long-term Environmental Monitoring: Support compliance, reporting, and sustainable management policies.

⚠ Risk or Limitation
NDVI can be affected by cloud cover, soil background, atmospheric conditions, or overlapping crops— consider supplementing with ground-based sensors or multi-index analytics for highest reliability.
⛏ Investor/GIS Bonus
NDVI analytics, blended with satellite-based traceability and resource monitoring, help mining and infrastructure firms analyze reclamation efforts, land cover impact, and optimize environmental compliance. Explore Farmonaut’s fleet/resource tools.
Frequently Asked Questions (FAQ)
- What is NDVI and why is it important?
NDVI stands for Normalized Difference Vegetation Index and is a remote sensing metric to assess vegetation health, crop biomass, and land condition by analyzing satellite data from red and near-infrared bands. It is vital for precision agriculture, ecological monitoring, and land management in 2026 and beyond. - How is NDVI calculated?
NDVI = (NIR – Red) / (NIR + Red), with “NIR” and “Red” referring to reflectance values in their respective bands as captured by satellite sensors. - Which satellites provide NDVI data?
Major sources include MODIS (Terra/Aqua), Landsat (8/9), and Sentinel-2A/B. Each offers different spatial resolutions and revisit rates suitable for different applications. - What are typical NDVI values for healthy crops?
Healthy, green crop areas usually yield NDVI values between +0.3 and +0.8. Values close to zero or negative indicate non-vegetative cover. - How can NDVI be accessed or integrated for custom solutions?
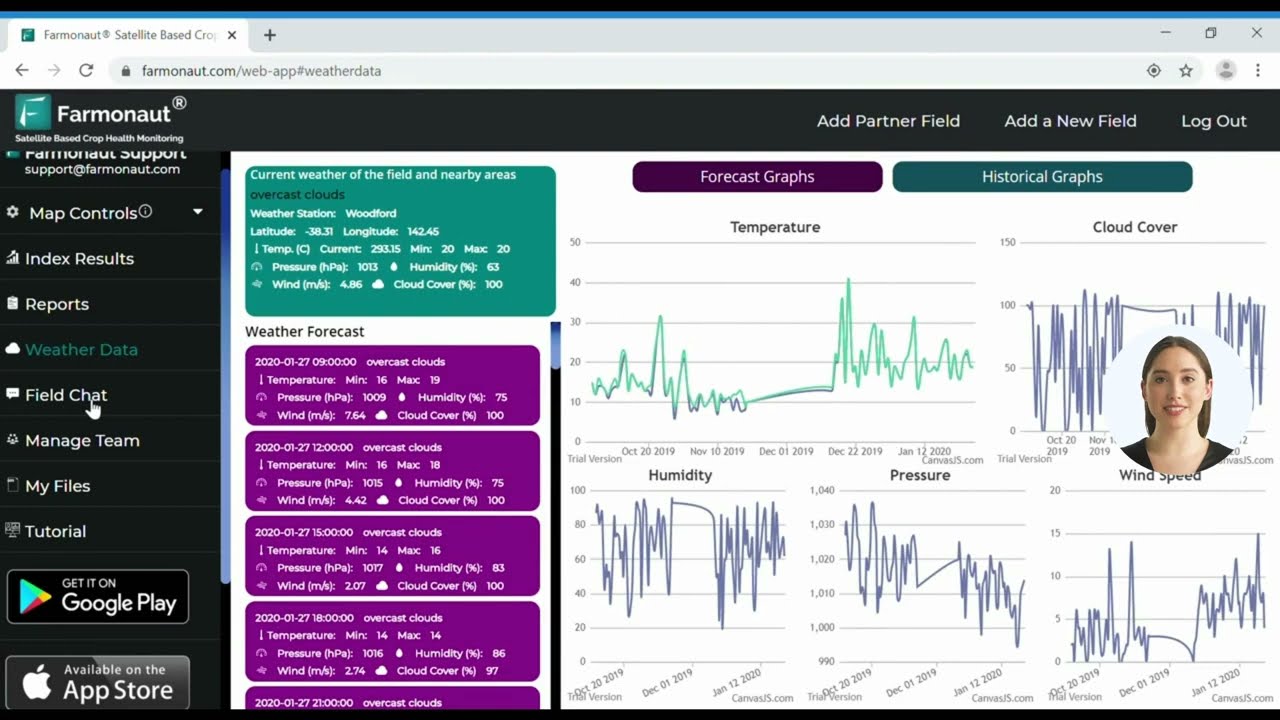
Farmonaut offers a user-friendly web and mobile platform for direct NDVI monitoring and an API for customized integration. Explore our APIs here.
- What is the difference between MODIS NDVI, Landsat NDVI, and Sentinel 2 NDVI?
MODIS offers broader but coarser (250m–1km) measurements for global/regional monitoring; Landsat provides detailed (30m) field-level analysis every 16 days; Sentinel-2 enables high-resolution (10m) and frequent (5-day) monitoring suited for precision farming and near-real-time management. - Can NDVI be used for forest monitoring?
Yes, NDVI supports forest health monitoring, biomass estimation, disease detection, and deforestation tracking—especially valuable for policymakers and conservation specialists. - Is Farmonaut an online marketplace or a regulatory agency?
No. Farmonaut is a satellite technology provider focusing on advanced remote sensing, resource management, and advisory solutions—not an input seller or regulator.
- Affordable, data-driven satellite monitoring and NDVI analytics
- AI and blockchain for maximum insight and transparency
- Real-time, scalable tools for agriculture, mining, and more
- Subscription model fits everyone from small farmers to large enterprises and governments
Conclusion: NDVI’s Role in the Future of Agriculture & Remote Sensing
NDVI continues to shape the future of precision agriculture, forestry management, and environmental research. From MODIS to Landsat and Sentinel-2, remote sensing has never been more powerful or accessible. By integrating NDVI metrics with platforms like Farmonaut, we usher in a new era of data-driven decision-making, enabling users to optimize yield, sustain resources, and adapt to climate realities in 2026 and beyond.
Use NDVI today as your essential tool for monitoring, management, and innovation—empowering every decision with reliable, timely, and scalable intelligence.
Subscribe to Farmonaut — Advanced Satellite Monitoring