NDVI Imaging in QGIS: Top 7 Satellite Agriculture Trends for 2025 & Beyond
“Over 80% of global crop monitoring maps in 2025 will use NDVI imaging via advanced satellite data and GIS platforms.”
Table of Contents
- Understanding NDVI Meaning & Its Significance
- Satellite Imaging in Agriculture: The Driving Force of NDVI
- NDVI in QGIS: Making Precision Farming Accessible
- Top 7 Satellite Agriculture Trends Enabled by NDVI & QGIS in 2025
- Practical Applications & Real-World Impact
- Comparative Table: The 7 Leading NDVI & QGIS Trends
- Farmonaut: Enabling Affordable, Scalable Satellite-Driven Agriculture
- FAQs: NDVI Imaging, QGIS, and Satellite Agriculture (2026+)
- Conclusion: NDVI, QGIS, and the Future of Sustainable Farming


Understanding NDVI Meaning & Its Significance in 2025 Agriculture
What is NDVI?
The Normalized Difference Vegetation Index (NDVI) stands as a foundational numerical indicator in remote sensing and agriculture, mathematically derived from satellite measurements of vegetation. NDVI meaning is rooted in its ability to assess the presence and condition of live green plants by analyzing how plants reflect solar radiation in different spectral bands. Specifically, NDVI calculates the difference between Near-Infrared (NIR) (strongly reflected by healthy vegetation) and Red light (absorbed by chlorophyll in plants):
NDVI Formula:
NDVI = (NIR – Red) / (NIR + Red)
The resulting NDVI values range between -1 and +1:
- Higher Positive Values (0.5–1): Indicate denser, healthier vegetation—such as thriving crops and forests.
- Near Zero (0 to 0.2): Correspond to bare soil or recently harvested/tilled land.
- Negative Values (-1 to 0): Denote bodies of water, clouds, or unhealthy, non-vegetated areas.
NDVI imaging is indispensable in modern precision agriculture because it offers a scalable, repeatable, and objective way to quantify crop vigor, diagnose stress, assess biomass, and monitor health across vast agricultural landscapes. From smallholder farmers monitoring a single field to countries overseeing millions of hectares, NDVI has dramatically improved the ability to make proactive, data-driven decisions about crop management and yield optimization.

Why is NDVI Imaging a Cornerstone in Satellite Imaging Agriculture?
- ✔ Quantitative monitoring of crop health for early intervention
- 📊 Data insight: Directly links to photosynthetic activity, giving accurate crop stress signals
- ⚠ Risk: NDVI alone may not distinguish between different types of crop stress (e.g., pest vs. drought)
- 🛰️ Satellite-based scalability: Enables temporal and spatial monitoring on local and global scales
- 💡 Enhancement: Combining NDVI with other indices in QGIS can improve the precision of stress identification
Satellite Imaging in Agriculture: The Driving Force of NDVI Monitoring
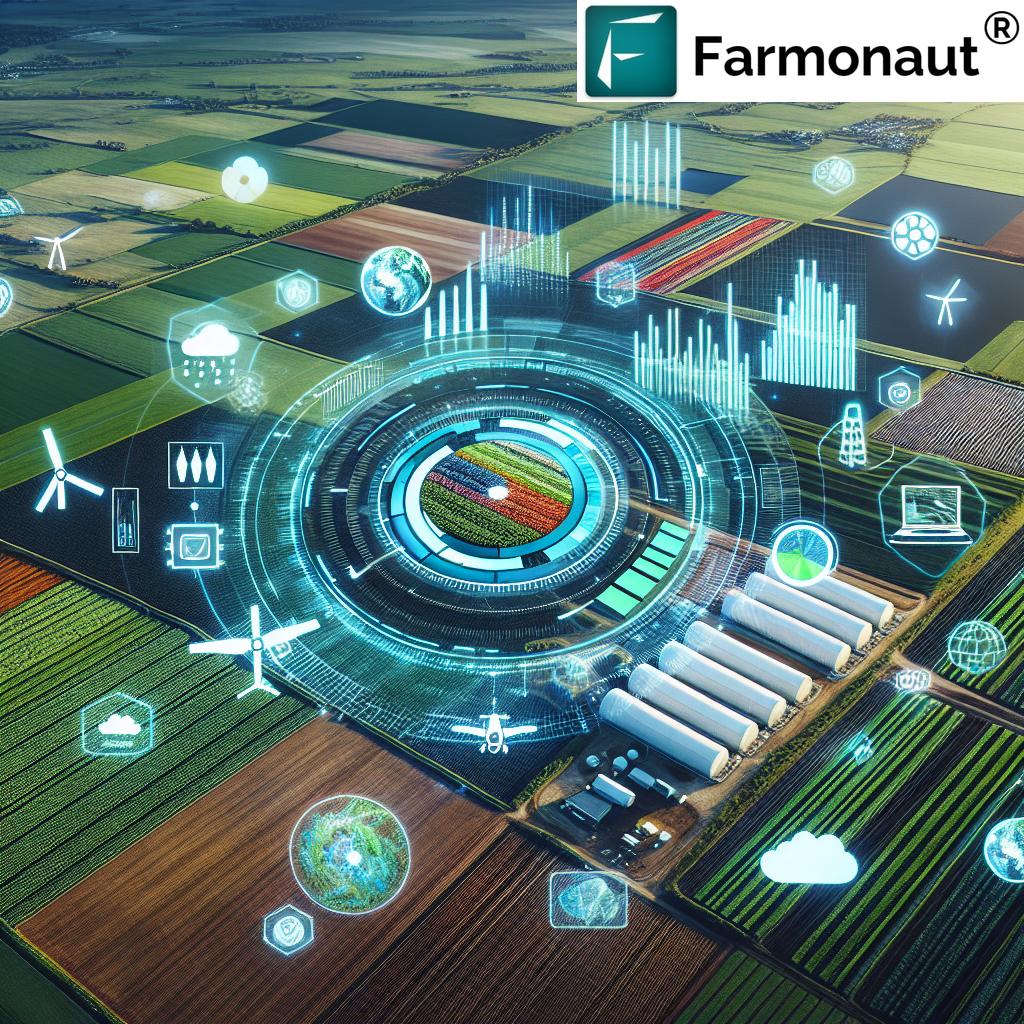
The role of satellite imaging in agriculture has expanded dramatically in recent years, and by 2025, we see unprecedented advances in both the sophistication and accessibility of these platforms. Earth observation satellites such as Sentinel-2, Landsat 9, and commercial constellations now provide multispectral data with high spatial and temporal resolution, capturing regular images of vast agricultural landscapes.
Key features of satellite imaging agriculture in 2025 and beyond include:
- High Frequency Coverage: Satellites like Sentinel-2 revisit agricultural fields every 3–5 days.
- Advanced Sensors: Multispectral and even hyperspectral sensors allow detailed analysis of crop vigor, moisture, and even early pest infestations.
- Large-Scale Monitoring: Agricultural sectors can now oversee millions of hectares via automated, cloud-based processing and data delivery.
“QGIS satellite tools analyze up to 300 million hectares of farmland annually, revolutionizing precision agriculture and yield prediction.”
How is NDVI Used Within Satellite Imaging Agriculture?
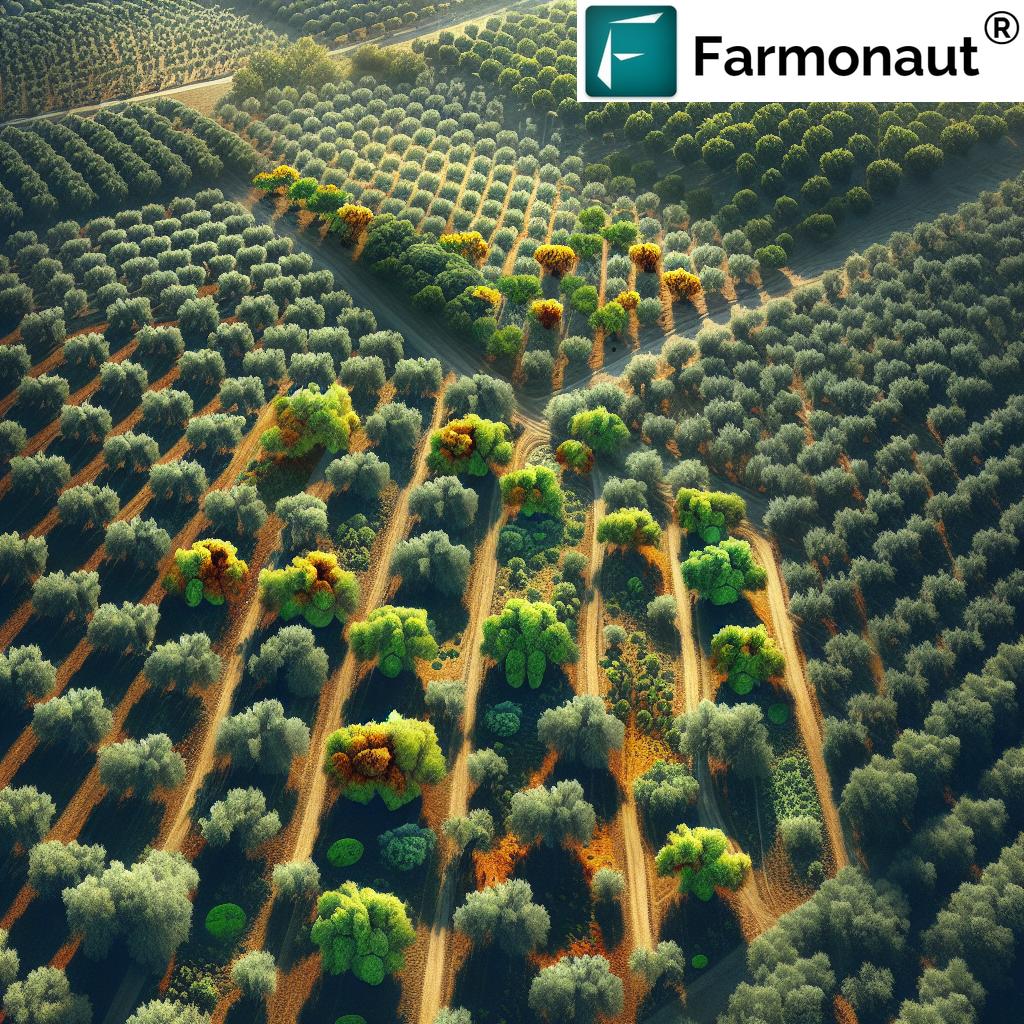
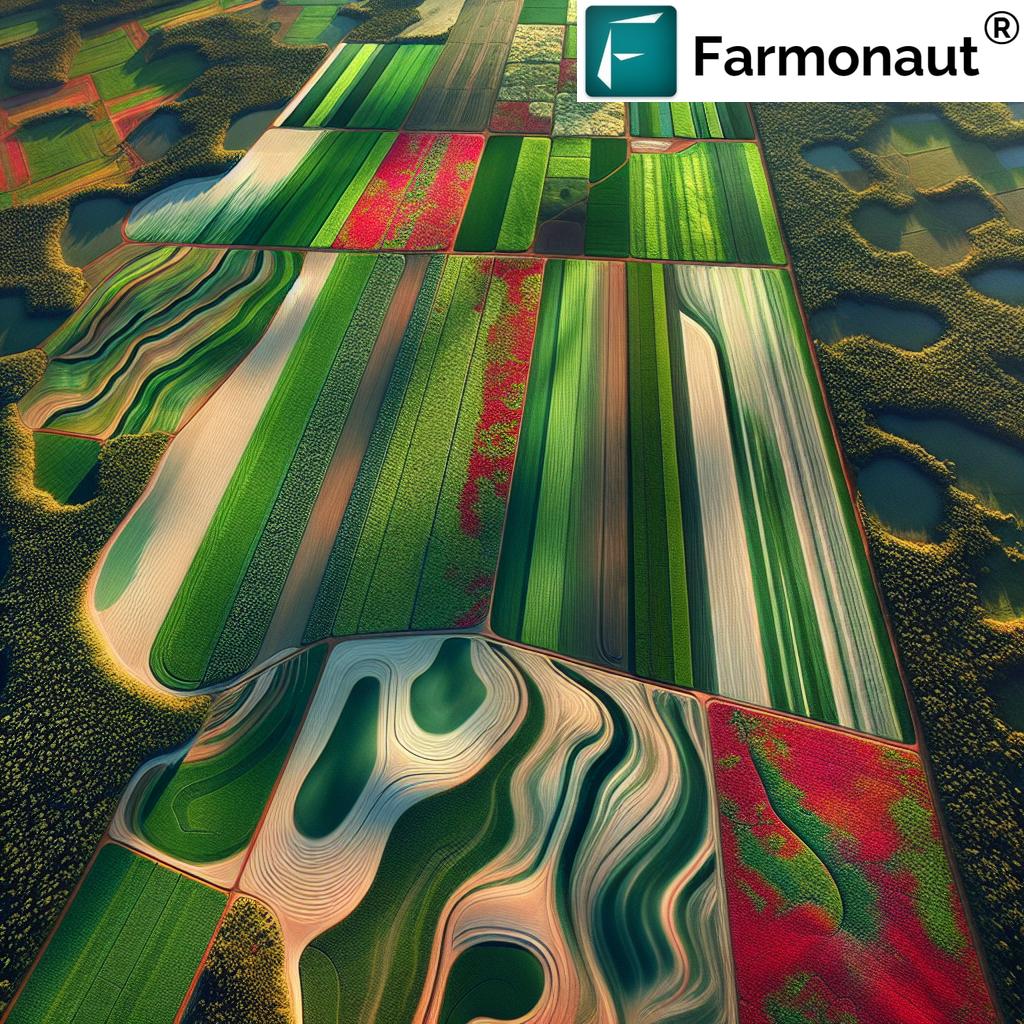
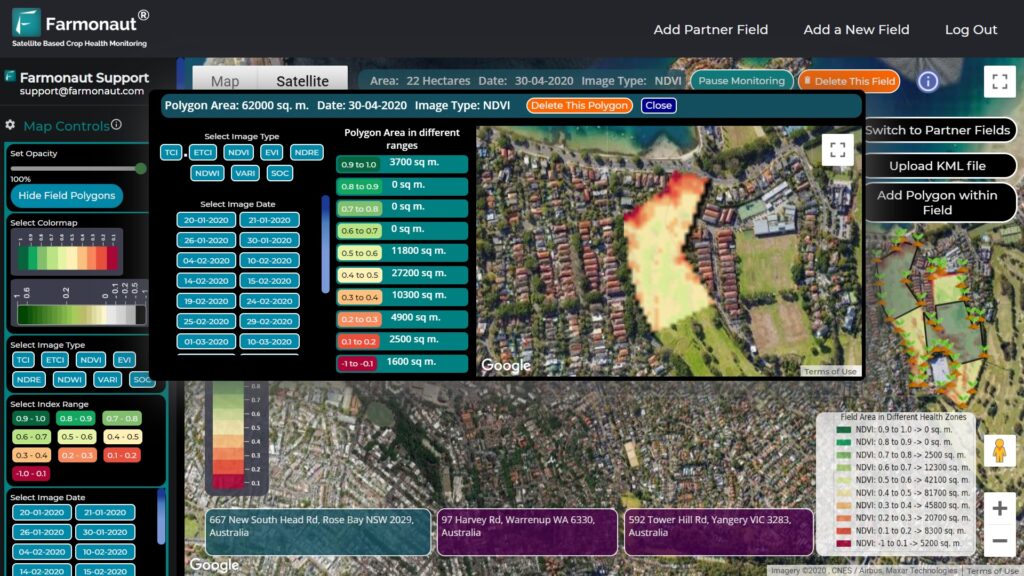
By processing multispectral satellite images, we generate NDVI maps that visually highlight areas of stress, denser growth, or bare soil in fields. When NDVI is low or turning negative, farmers are alerted to deploy targeted interventions—whether it be irrigation, fertilizer, or pest control—well before visual symptoms appear to the naked eye.
Key Advantages of NDVI Imaging in Modern Satellite Agriculture:
- 🌱 Early detection: Proactive identification of disease, drought, or nutrient stress enhances crop outcomes
- 📈 Yield optimization: Data-driven crop management for improved production and efficiency
- 💡 Resource efficiency: Reduced waste by targeting interventions only where needed
- 🌍 Environmental stewardship: Lower input use supports sustainable farming practices
NDVI in QGIS: Making Precision Farming Accessible with Open Source GIS
QGIS (Geographic Information System) has revolutionized NDVI imaging by making it accessible, free, and highly customizable for every stakeholder in the agricultural sector. By 2025, NDVI in QGIS is a staple workflow, from field-level crop monitoring to large-scale agribusiness analytics.
NDVI QGIS processing steps typically involve:
- Importing satellite multispectral images (from Sentinel-2, Landsat 9, or commercial satellites)
- Using Raster Calculator to apply the NDVI formula: (NIR – Red) / (NIR + Red)
- Visualizing NDVI values with color-coded maps for healthy vs. stressed vegetation
- Overlaying field boundaries, soil, irrigation, and yield data as layers for holistic analysis
- Batch processing with QGIS plugins for time-series NDVI monitoring
The integration of NDVI imaging with QGIS in agriculture represents one of the fastest-growing segments in the agri-tech market, with a projected multi-billion dollar impact on input optimization, insurance risk reduction, and sustainable crop yield improvement by 2026.
- 🔍 Intuitive visualization of vegetation health trends across fields
- 🛠 Customizable analysis via plugins and automated workflows for batch NDVI calculations
- ⏱ Temporal monitoring for crop development tracking through the growing season
- 🌍 Spatial integration with field borders, soil layers, and yield maps for context

Why Choose Open Source QGIS for NDVI?
- ✔ Cost effective: No license fees, suitable for individual farmers and global organizations alike
- 💡 Advanced GIS: Supports spatial, temporal, and multi-layer analysis of agricultural data
- ⏩ Rapid innovation: Continuous plugin development ensures up-to-date features
Top 7 Satellite Agriculture Trends Enabled by NDVI & QGIS in 2025
As NDVI imaging and QGIS GIS platforms mature, seven core trends stand out for their potential to transform agriculture globally. Here’s how these trends intertwine satellite imaging agriculture and cutting-edge NDVI QGIS workflows:
Comparative Table: NDVI & QGIS—Top 7 Agriculture Trends (2025)
| Trend Name | Brief Description | Role of NDVI Imaging | QGIS Integration | Estimated Impact on Crop Yield (%) in 2025 |
|---|---|---|---|---|
| Precision Crop Health Monitoring | Automated, continuous detection of crop stress and health anomalies. | Flags areas with abnormal NDVI values for rapid, targeted intervention. | QGIS visualizes time-series NDVI & overlays with field management data. | +10% |
| Algorithmic Yield Prediction | Utilization of NDVI trends and AI for accurate, dynamic yield forecasts. | Correlates NDVI time-series data with historical yield for predictions. | Plugins automate spatial data correlation and visualization in QGIS. | +13% |
| Resource-Efficient Irrigation Management | Optimization of water application based on real-time field status. | Detects water stress via declining NDVI in specific field zones. | QGIS maps overlay NDVI with soil moisture; supports drip/flood plans. | +8% |
| Early Pest & Disease Outbreak Alerts | Detection of subtle changes before symptoms are visually apparent. | NDVI drop-off signals hotspots for pests/diseases, prompting rapid action. | Field alert zones visualized with NDVI in QGIS for farm teams. | +11% |
| Sustainability & Carbon Footprint Tracking | Monitoring field-level biomass and adoption of eco-friendly practices. | Enables assessment of vegetation growth patterns & carbon sequestration. | QGIS quantifies NDVI change over seasons for carbon assessments. | +6% |
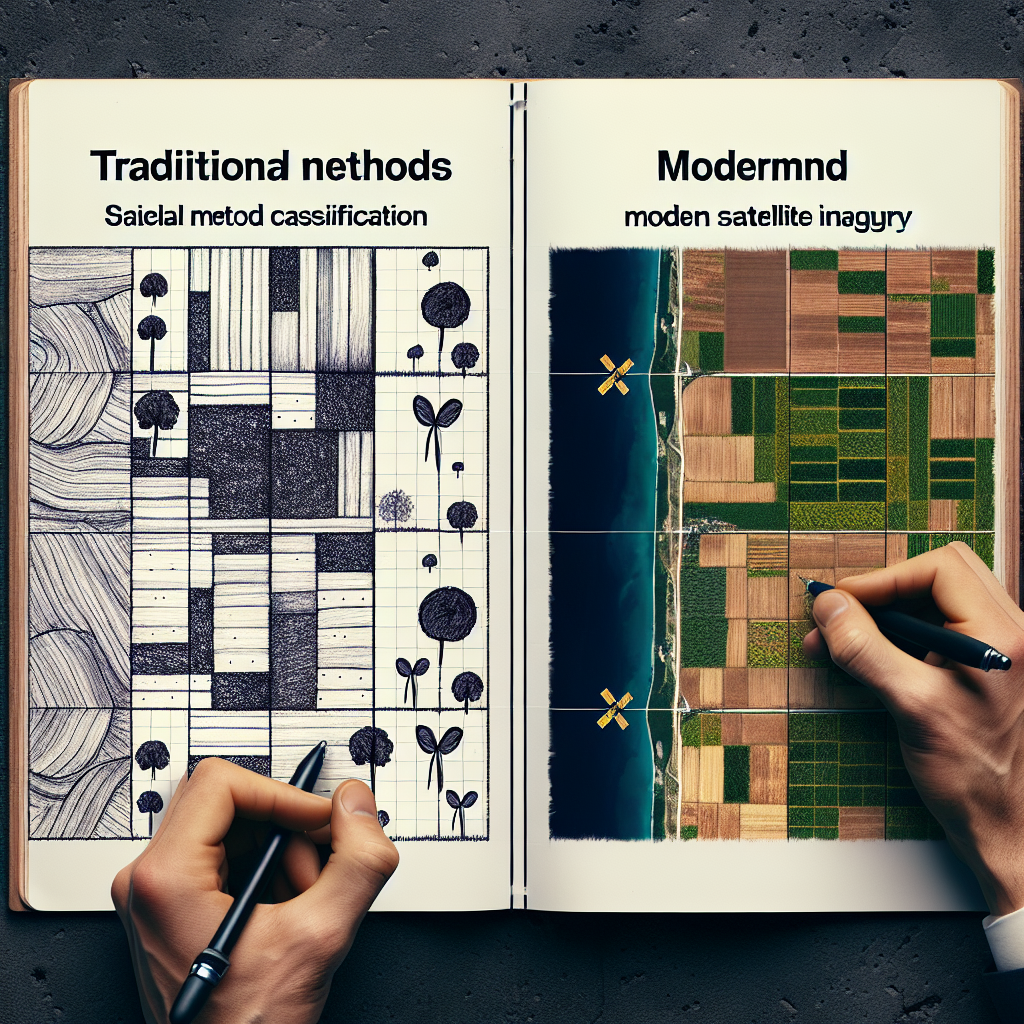
| Automated Crop-Type Classification | AI models distinguish crops using NDVI profiles and spatial patterns. | NDVI patterns are fed into ML algorithms for mapping crop types. | QGIS allows visualization and editing of classified field layers. | +5% |
| Blockchain-based Crop Traceability | Transparent supply chain linked to NDVI-driven verification steps. | NDVI and field activity logs anchor traceability and compliance records. | QGIS exports NDVI events to integrate with blockchain traceability systems. | +9% |
- 📊 Precision management of each field zone means higher overall farm productivity
- 🛡️ Reduced risk of yield loss from unseen stress factors
- 🔗 Seamless traceability supports food safety and compliance in global supply chains (Explore Farmonaut’s Blockchain Traceability Tools)
- 🌡️ Finetuned irrigation saves water and energy, critical in drought-prone regions
- 🔄 Automated analysis allows quick adaptation to changing field or market conditions
Practical Applications & Real-World Impact of NDVI Imaging in QGIS
NDVI imaging via QGIS platforms supports real-world agricultural applications with direct impacts on productivity, risk reduction, and profitability:
- 🌾 Field Scouting: Easily identify and investigate areas of low NDVI for manual inspection or targeted drone imaging.
- 🧬 Automated Yield Prediction: Use NDVI trend data to forecast yield and inform supply chain logistics, marketing, and inventory planning.
- 🚜 Irrigation Optimization: Detect water-stressed sections using NDVI, then apply precision irrigation only where necessary to maximize water use efficiency.
- 🦠 Early Pest & Disease Intervention: Rapidly respond to pest-infested or diseased zones by overlaying pest risk models on current NDVI data within QGIS.

- 🌱 Crop health monitoring: Spotting stress early with spatial NDVI patterns
- 💧 Water management: Matching irrigation to regional NDVI trends; reducing cost and environmental impact
- 🦠 Pest/disease alerts: Flagging abnormal drops in NDVI for fast intervention
- 📈 Yield calculation: Cross-referencing NDVI history with known output for accurate forecasting
- 🔍 Land planning: Combining NDVI with soil, weather, and management data to decide crop rotation/fallow periods
Sustainability and compliance are also greatly enhanced as NDVI data allows the establishment of field-level records for environmental and supply chain audits. In regions where traceability and carbon accounting are required, such as the European Union, NDVI is now an essential input.
NDVI imaging paired with GIS is transforming the landscape of real-time crop monitoring—from small farms in India and Brazil to vast wheat fields in Ukraine and the U.S. Midwest.

Integrating NDVI in QGIS with Modern Advisory & Traceability Tools
Modern NDVI QGIS workflows connect directly with advisory systems and supply chain innovations to add even more value:
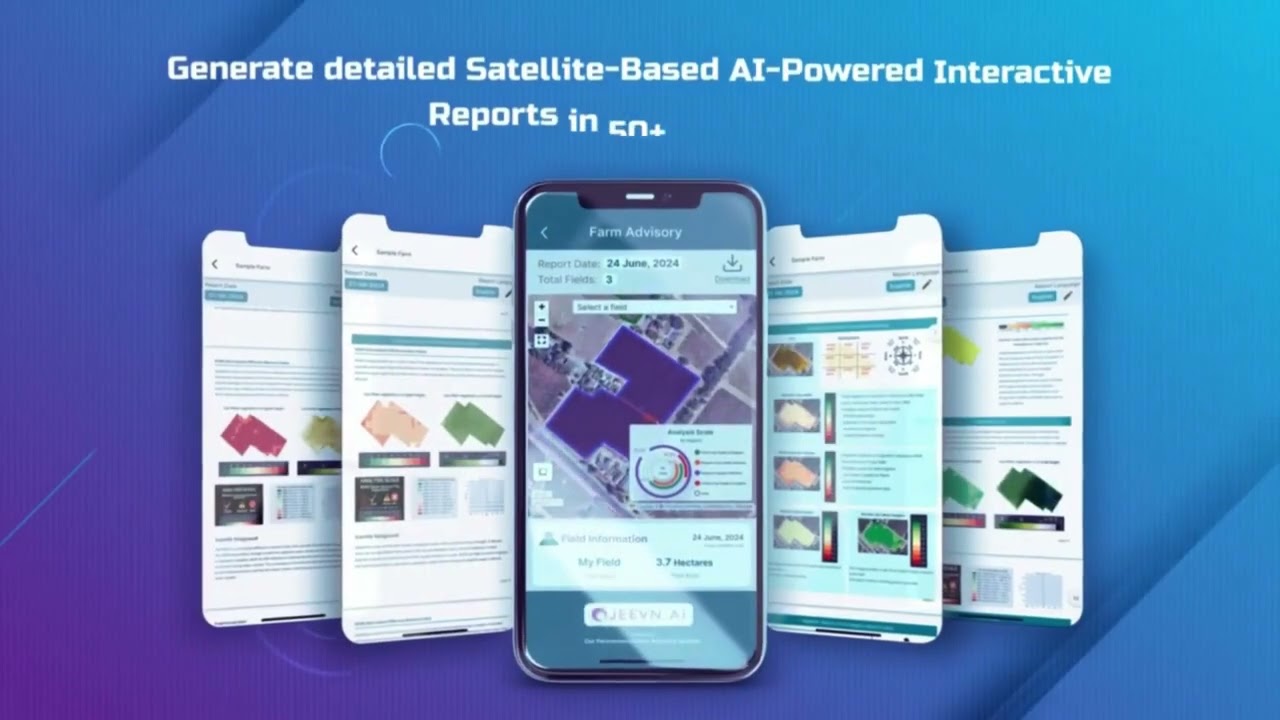
- 🧑🔬 AI-Based Crop Advisory: AI engines analyze historical NDVI, forecast weather, and generate actionable advice in real time. See how this works in Farmonaut’s Jeevn AI Advisory System, accessible via web, Android, and iOS apps!
- 🔗 Blockchain Traceability Integration: NDVI-validated field events get securely logged on blockchain for foolproof tracking. Explore Farmonaut’s Traceability Solution.
- ⚖️ Insurance and Lending Support: Satellite NDVI maps streamline crop loan and insurance verification (see Farmonaut’s Crop Insurance platform)
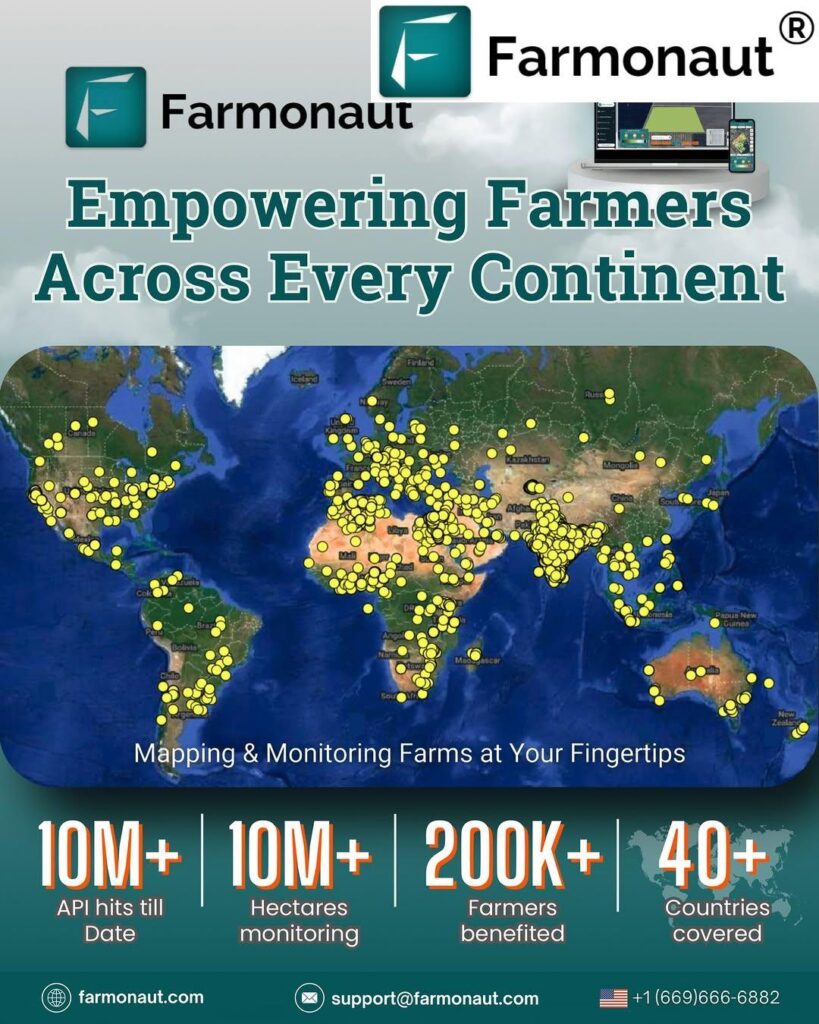
Farmonaut: Affordable & Scalable Satellite NDVI Imaging for Every Stakeholder
At Farmonaut, we believe NDVI imaging and satellite data should be accessible to every farmer, business, and government. By integrating AI, blockchain, and machine learning with real-time satellite crop and soil monitoring, our platform delivers reliable data, insights, and traceability at every scale—from smallholders to global agribusiness.
- 🌐 Flexible Platform: Web, Android, iOS, API and browser-based access, serving varied technical needs (Try Our Apps)
- 📈 Enhanced Productivity: Satellite-driven NDVI supports operational efficiency, yield improvements, and risk minimization
- 🌱 Sustainability: Tools like carbon footprint monitoring help meet regulatory & market sustainability demands
- 🔗 Transparency: Blockchain-based traceability builds trust for loans, food safety, and export compliance (Explore Traceability)
- ⚡ Scalable Pricing: Modular subscription plans for individuals, businesses, and governments—grow with your needs!
Why Choose Farmonaut’s NDVI and Satellite Imaging Solutions?
- 📲 Seamless experience: Switch between web and mobile apps for flexible monitoring
- ⚡ Automated advisory: AI-based Jeevn system generates custom recommendations from NDVI data
- 🔐 Blockchain integration: Secure, transparent record-keeping for traceability and supply chain audits
- ⏳ Hourly, daily, or custom intervals: Choose your preferred frequency for NDVI and satellite data updates
- 🧑🌾 User-friendly for all: From first-time users to enterprise managers, Farmonaut’s UI and support empower every stakeholder
FAQs: NDVI Imaging, QGIS, and Satellite Agriculture (2026+)
What is the meaning of NDVI in simple terms?
NDVI stands for Normalized Difference Vegetation Index. It is a metric derived from satellite or drone images that measures plant health by comparing light reflected in the near-infrared and red spectral bands. Higher values mean healthier vegetation; low or negative values mean less or no green vegetation.
How do I perform NDVI calculations within QGIS?
In QGIS, you can import multispectral satellite images (such as Sentinel-2), use the Raster Calculator tool, and apply the formula: (NIR – Red) / (NIR + Red). QGIS allows visualization, overlay, and analysis of NDVI data directly, supporting plugins for batch temporal processing.
Are satellite-based NDVI maps better than drone-based NDVI?
Satellite NDVI offers consistent, large-area, and regular (temporal) updates, making it ideal for regional/national scale agriculture. Drones provide higher spatial resolution and flexibility for small or critical areas. Combining both yields the most precise, actionable insights.
Can NDVI imaging be used for sustainable farming and carbon tracking?
Absolutely. NDVI time-series data can quantify vegetation growth, helping calculate carbon footprint reduction, monitor reforestation, and prove compliance for “green” market access and carbon credits.
How does Farmonaut help me monitor crops with NDVI and QGIS?
We provide satellite-driven NDVI imagery, health and stress alerts, field/fleet/resource management, and advisory solutions accessible via web, Android, iOS, and APIs. Integration with open-source QGIS enables advanced mapping, analysis, and reporting, scaling from individual fields to millions of hectares.
Conclusion: NDVI, QGIS & the Future of Sustainable Agriculture (2025 and Beyond)
NDVI imaging—empowered by cutting-edge satellite platforms and the accessible, versatile environment of QGIS—is redefining the precision, sustainability, and profitability of agriculture in 2025, 2026, and beyond. By providing clear, objective, and actionable metrics of vegetation health, NDVI is central to a new era of data-driven farming—boosting productivity, minimizing waste, and supporting sustainable stewardship of agricultural landscapes worldwide.
Whether you’re a smallholder farmer optimizing a single field or a global agribusiness managing millions of acres, the integration of NDVI, QGIS, and satellite data provides the roadmap for profitable, sustainable food production and environmental security in a climate-challenged future.
At Farmonaut, we invite you to join this new era by leveraging affordable, scalable, and innovative satellite-driven crop monitoring and advisory solutions.